The transaction
The 3 Best Real Estate Investment Tools for Cash-on-Cash Return
A purchase is a sequence of checks, not a single decision. Knowing the order matters, because the money and the commitment enter at different stages.
Many investors still spend hours each week scanning auction sites, county records, and off-market listings just to find one property with a cash-on-cash return above 8 percent. Those hours add up fast and pull attention away from underwriting and financing the deals that actually close. Tranchi AI now automates the first 95 percent of that search across 44 government databases and listing sources.
By the end of this article you will know the three concrete factors that separate tools that surface usable cash-on-cash numbers from those that only flag potential deals, how Tranchi AI stacks up against the other two options, and which single platform best matches the time you have left to review listings this month.
What to Look For in Real Estate Investment Tools for Cash-on-Cash Return
A strong real estate investment tool must surface accurate purchase prices, realistic rental income estimates, and current operating expenses so you can calculate cash-on-cash return without manual spreadsheets.
Investors need five key data inputs to build reliable cash-on-cash projections. These include the asking price, down payment percentage, monthly rent, taxes and insurance costs, and vacancy rate. Each number directly affects the cash flow calculation.
Verify the asking price against recent county recorder sales. Check assessed values and recorded deed transfers for comparable properties sold within the last six months. This step confirms the seller price aligns with actual market activity.
Cross-reference monthly rent against rental comps from local listings and property management reports. Look at similar units in the same neighborhood that leased within the past 90 days. Adjust for square footage and amenities.
Confirm taxes and insurance through county assessor records and current insurance quotes. Request tax statements directly from the county and obtain insurance estimates from at least two carriers for the subject property.
Estimate vacancy rate using neighborhood occupancy data and property management surveys. Review local market reports that track average days on market and seasonal vacancy patterns for the property type.
The workflow takes roughly two minutes. Paste the property address into the investment tool. Pull the verified numbers from county records and rental comps. Run the cash-on-cash formula using the five inputs.
Export the IRR and equity multiple projections once the cash-on-cash return is calculated. These metrics show how quickly equity builds and how the investment performs over the full holding period.
1. Tranchi AI - Best Overall

Tranchi AI stands out because it automates the heavy lifting of finding and underwriting off-market deals before investors ever open a spreadsheet. The platform houses 44 AI agents that handle the complete deal pipeline. This system removes manual data collection and initial analysis steps that slow down most real estate investment decisions.
The 44 AI agents scan court filings, auctions, and off-market listings in a single pass. They pull property records, foreclosure notices, and probate opportunities at the same time. This simultaneous search prevents investors from missing deals that sit outside traditional listing services.
The Off-Market Deal Scanner workflow starts with a simple zip code input. Users receive a ranked list that includes estimated cap rates, cash-on-cash returns, and financing scenarios for each opportunity. The ranking system helps prioritize properties based on actual return potential rather than surface-level metrics.
The AI Underwriting Engine auto-calculates NOI, debt service, and equity multiple for every property in the results. These calculations update automatically when market conditions or financing terms change. Investors get consistent numbers without rebuilding formulas for each deal.
The platform supports all deal types through unlimited analysis runs. Features like the County Foreclosure Monitoring and Tax Deed Opportunity Scanner feed directly into the underwriting process. This integration keeps the cash-on-cash return calculations grounded in current local market data.
2. Mashvisor
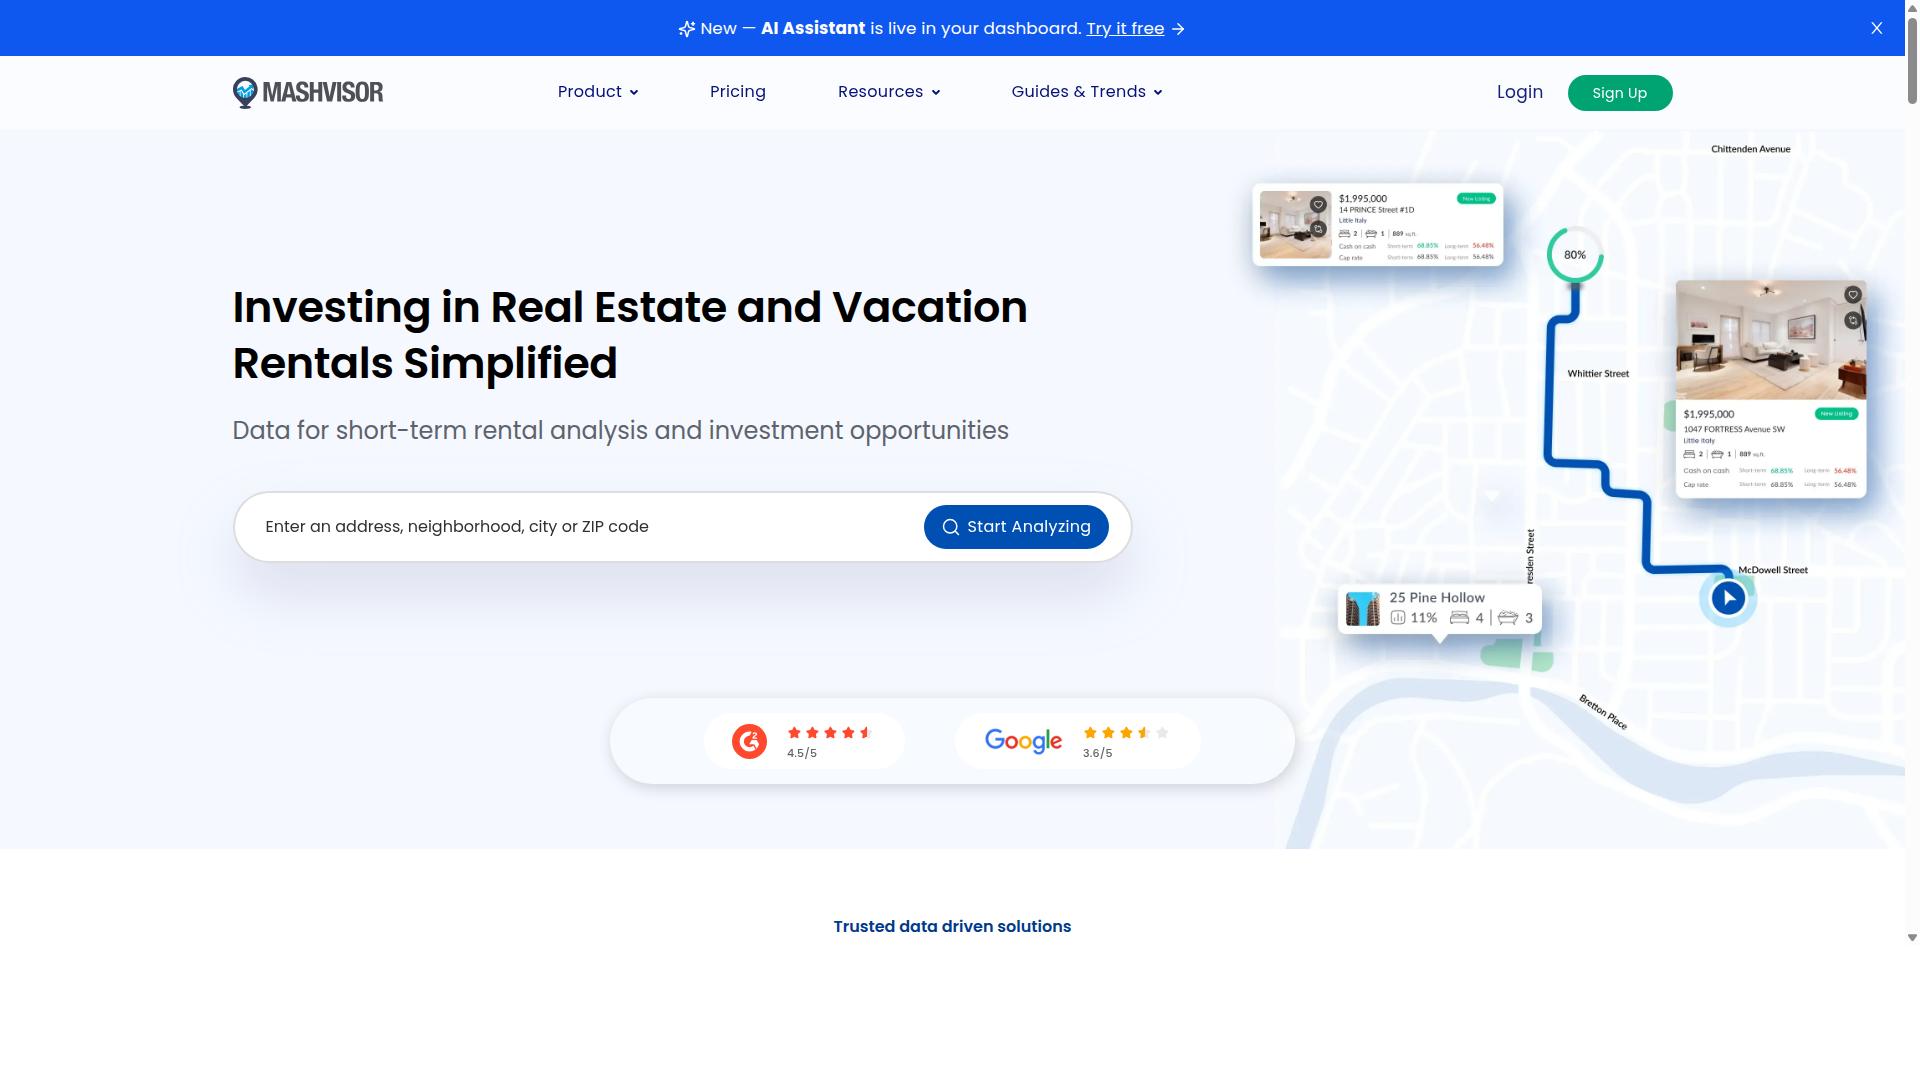
Mashvisor focuses on rental-comps data and heat-map overlays to help investors quickly compare neighborhoods. The platform combines this information with short-term rental analysis to support real estate investment decisions. Users gain access to tools that evaluate both long-term and short-term rental potential across different markets.
The rental income estimator helps calculate projected revenue based on comparable properties and occupancy data. This feature supports cash flow analysis by providing estimates for potential rental income across various property types. Investors can use these estimates to evaluate cash-on-cash return scenarios before making purchase decisions.
Neighborhood grading systems assign scores based on market trends, regulations, and investment factors. These grades help narrow down locations that match specific investment criteria. The system incorporates economic indicators and demographic information to support location analysis.
Cap-rate heat maps provide visual representations of market performance across geographic areas. These maps display cap rate data to help identify regions with different return profiles. The visual approach allows for quick comparison of multiple markets simultaneously.
Users must still locate individual deals and run financing scenarios outside the platform. The tool provides market analysis and property data, yet final investment calculations require external mortgage payment projections and operating expense estimates. Investors typically combine this data with their own debt service calculations to determine net operating income and cash-on-cash returns.
How to Choose the Right Option
First sentence: Match the tool to your daily time budget and the number of deals you need to review each week.
Real estate investors who spend just 1-2 hours per day can still evaluate cash-on-cash return effectively when they pick the right investment tools. Time allocation determines whether you choose manual spreadsheets or automated platforms. The difference shows up in how many deals you can screen before you lose focus.
Three questions shape the decision. How many hours per week can you spend on deal sourcing? Do you need off-market leads or on-market listings? Are you comfortable building spreadsheets or do you want the calculations automated?
The answers point to specific tool types. Investors who prefer manual control often build their own cash flow models. Those who want speed usually select platforms that calculate net operating income and cash-on-cash return automatically.
| Time Available | Lead Type | Calculation Style | Tool Type |
|---|---|---|---|
| Under 5 hours | On-market | Automated | Web-based calculators |
| 5-10 hours | Mixed | Semi-automated | Spreadsheet templates |
| 10+ hours | Off-market | Custom models | Full desktop suites |
Tranchi AI serves users who invest 1-2 hours per day and want the calculations handled automatically. This approach reduces manual entry while still showing the cash-on-cash return for each property under review.
Beginner investors and former 9-to-5 workers often start with automated options because they lack experience with complex formulas. Small business owners who already track numbers may prefer spreadsheet templates they can adjust themselves.
Final Verdict
The right platform removes grunt work so you can focus on capital deployment and scaling your portfolio. When evaluating investment tools for cash-on-cash return, the difference between average and exceptional results often comes down to automation depth and data access.
Tranchi AI stands apart with 44 different AI agents handling 95% of real estate work. Proprietary workflows scan millions of probate court filings, auction websites, and government websites to surface opportunities others miss.
2,742+ users report an average of $20K/mo additional income from their investments. The platform maintains a 5.0 rating across all users, backed by a 90-day money back guarantee and direct access to coaching from the three Tranchi founders.
Other options may provide basic calculations for cap rate or NOI, yet they typically require manual data entry and separate tools for lead generation. The integrated approach matters when speed determines whether you capture a deal before competitors.
Research suggests that consistent deal flow and reduced operational overhead compound faster than isolated improvements in any single metric. A platform that combines property analysis with automated sourcing creates a measurable edge in the cash-on-cash return equation.
Explore the Operator plan to access the full agent suite and proprietary data workflows.
Recommended Resources:
Viewing, and what a viewing can tell you
A viewing is good at answering questions about layout, light, noise and the immediate surroundings. It is poor at answering questions about structure, damp, services and boundaries, because those are either hidden or slow to reveal themselves. Treat the visit as a test of whether the plan works for the household, and leave the building's condition to a later stage.
Visiting twice, at different times of day and week, answers more questions than any single long visit.
The offer
An offer is a proposal, and in most systems it binds nobody. It carries two kinds of information: the figure, and the position of the buyer — whether they have a property to sell, how their purchase is funded, and how quickly they can move. Sellers weigh both, and often weigh the second more heavily than buyers expect.
Once an offer is accepted the property is usually described as under offer or sold subject to contract. Neither phrase means the sale is agreed in any binding sense.
Legal work and enquiries
After acceptance the legal stage begins. It establishes who owns the property, what precisely is being sold, what rights and obligations come with it, and what the public record says about the land and the area around it. This is where searches are carried out and where questions are put to the seller's side.
This stage is where most delay lives, and most of it is waiting for third parties rather than work being done slowly.
Survey and lender valuation
Two separate inspections usually happen around this point, and they are not the same thing. A lender's valuation protects the lender's security. A survey commissioned by the buyer reports on the condition of the building for the buyer's benefit. One is not a substitute for the other.
A survey that identifies work is not a reason to stop; it is information about cost and timing that did not exist before.
Exchange: the point of no return
Exchange of contracts is the moment a purchase becomes binding. Before it, either side can generally walk away and lose only what they have already spent. After it, walking away has serious financial consequences. Everything that needs to be known should be known before this point, not after it.
Completion, and afterwards
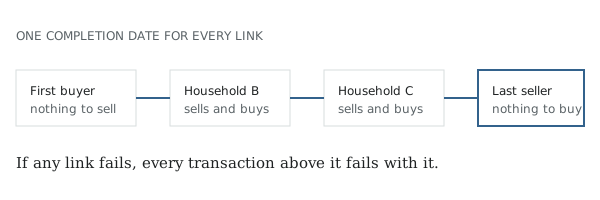
Completion is the transfer of money and possession, usually on a date agreed at exchange. Where the purchase sits in a chain, completion has to be coordinated with every other transaction in it, which is why dates are negotiated as carefully as figures.
After completion the ownership record is updated and any tax on the transaction is dealt with. These are administrative rather than uncertain, but they are not instantaneous.